
Monthly Market Update May 2026
Stay informed with the latest news and insights from Oxonian Capital's Monthly Market Update.
May 2026 Update:
MARKET NEWS
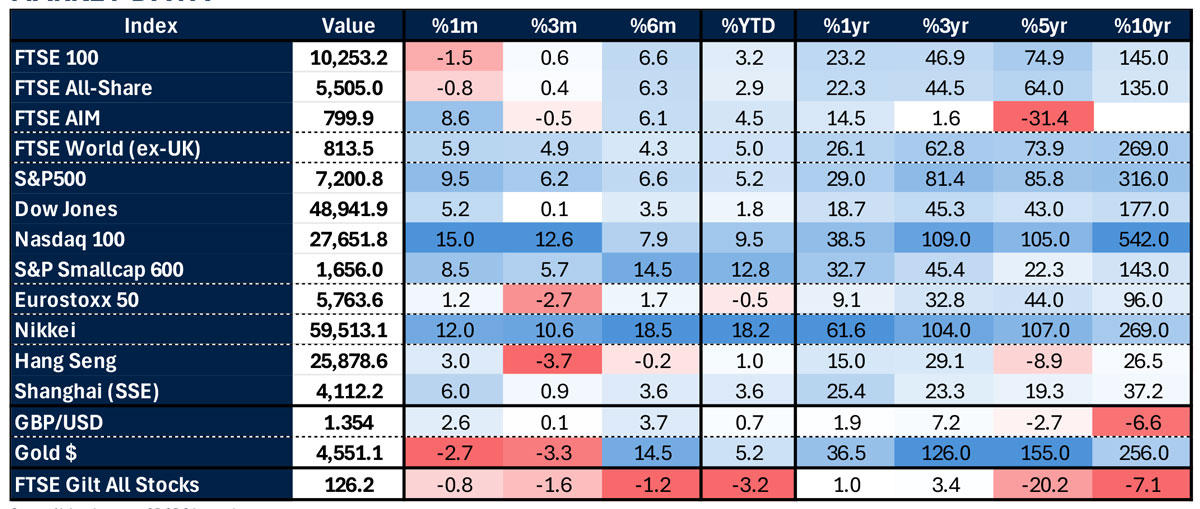
EQUITIES: After a painful March, global equities delivered a significant recovery in April. The S&P 500 index rose +10.5%, its strongest month in over 5 years. Within that, the PHLX Semiconductor index surged +38.4%, its best month since February 2000. Emerging markets were also buoyant, with the MSCI EM index up +14.7% – its strongest monthly return since November 2022. European and Japanese equities also participated, with the STOXX 600 gaining +5.6%, and the Nikkei up +16.1%. The FTSE 100 lagged at +2.3%, with major oil, pharmaceutical and tobacco names holding the index back.
With around two thirds of S&P 500 companies now having reported, over 80% beat both earnings and revenue expectations. We saw notable market reactions to some major names in the index, with Facebook and Instagram owner, Meta falling -8.5%, and Google parent, Alphabet rising by +10%.
CURRENCY: The U.S. dollar was a notable loser, with the DXY index falling -1.9% – weakening against every G10 currency. Sterling gained +2.9% against the dollar and +1.3% against the euro, though remains caught between a hawkish Bank of England and fragile economic growth. The yen's +1.4% move against the dollar understates the tension building at the Bank of Japan, where a 6-3 vote to hold rates masked growing pressure for a June hike. As the August 2024 yen carry trade unwinding reminded us, yen moves have consequences well beyond Japan. Bitcoin recovered more than 30% from February lows to around $80,000, though remains -7% year-to-date, a useful reminder crypto volatility moves decisively in both directions.
BONDS: Government bonds were also among the month's casualties, with multi-decade highs in yields across developed markets. U.K. 10-year Gilt yields reached 5.07% (post-2008 highs), Germany's 10-year Bund yield hit 3.11% (post-2011 high), and Japan's 10-year yield above 2.5% (last seen in 1997). U.S. Treasury yields also rose, with the 10-year yield at 4.37%. The painful 2022 dynamic of bonds and equities selling off in tandem repeated, undermining the traditional diversification argument. Short-dated credit and index-linked bonds fared much better.
ALTERNATIVES: The price of Brent crude fell to $90/bbl in mid-April as ceasefire optimism peaked, before rising again as talks stalled – ending April at $114/bbl, up +87.4% year-to-date. Six-month futures prices reached $90/bbl – the highest level since the start of the conflict, suggesting markets are beginning to price a more extended disruption than initially assumed.
Gold fell -1.1% in April, reflecting rising real yields and recovering risk appetite, though it remains up +7% year-to-date and is the best-performing major asset class of 2026 to the end of April. Agricultural commodities added to inflationary pressures, with wheat +1.2% and corn +1.5% over the course of the month.
MACRO NEWS
POLITICS: Geopolitics remains dominated by the impasse between the U.S. and Iran. The ongoing blockade of the Strait of Hormuz have created a negative supply shock. While President Trump’s “red lines” regarding Tehran’s nuclear ambitions remain a sticking point, the market is closely watching for any signs of a diplomatic breakthrough that could reopen the Strait. The conflict remains the most important variable for asset prices globally.
The political map in Europe shifted with the defeat of Viktor Orbán in Hungary marking the end of an era and suggesting a potential recalibration of power dynamics within the E.U., which could lead to greater cohesion in foreign and energy policy. In the U.K., with May local elections approaching, the political calendar adds further uncertainty to the domestic backdrop.
Canada's pivot away from Washington is also of note. Having seen sustained tariff pressure, the Canadian government is deepening ties with Europe, Australia and CPTPP partners as part of a broader division of trade that could have implications for supply chains and capital allocation well beyond North America.
MONETARY POLICY: The inflationary consequences of the oil shock are now clearly visible in the data. U.S. CPI for March showed monthly inflation of +0.87% – the largest monthly gain since June 2022. Eurozone CPI for April also rose, to +3.0%, its highest since September 2023. Market expectations for 1-year inflation ticked higher, by 0.22% in the U.S. and 0.44% in Europe. In the U.S. this all means markets are now pricing no further move in Federal Reserve interest rates this year, and so far central banks are acting with caution. The Fed held rates but saw three members’ dissent. The Bank of England also held rates at 3.75%, in an 8-1 vote, with one member voting for an immediate hike and Governor Andrew Bailey explicitly refusing to rule out further increases – a marked shift in tone. The ECB, having cut rates eight times since mid-2024, has also paused and the comfortable easing cycle that defined 2025 has been decisively interrupted – and the path back to it not straightforward.
STAGFLATION: The International Energy Authority (IEA) has branded the current disruption as the largest in the history of the global oil market. With sovereign bond yields hitting multi-decade highs, inflation data surprising to the upside, and growth forecasts being revised down, 1970s parallels are not without merit. There are, however, important differences. Central banks are more credible, and independent, than they were 50 years ago. While oil futures have moved higher, the market still implies a degree of mean reversion – i.e. they are not yet pricing a permanent shift in energy costs. Whether that proves correct depends on how the Iran situation resolves.
CHART OF THE MONTH
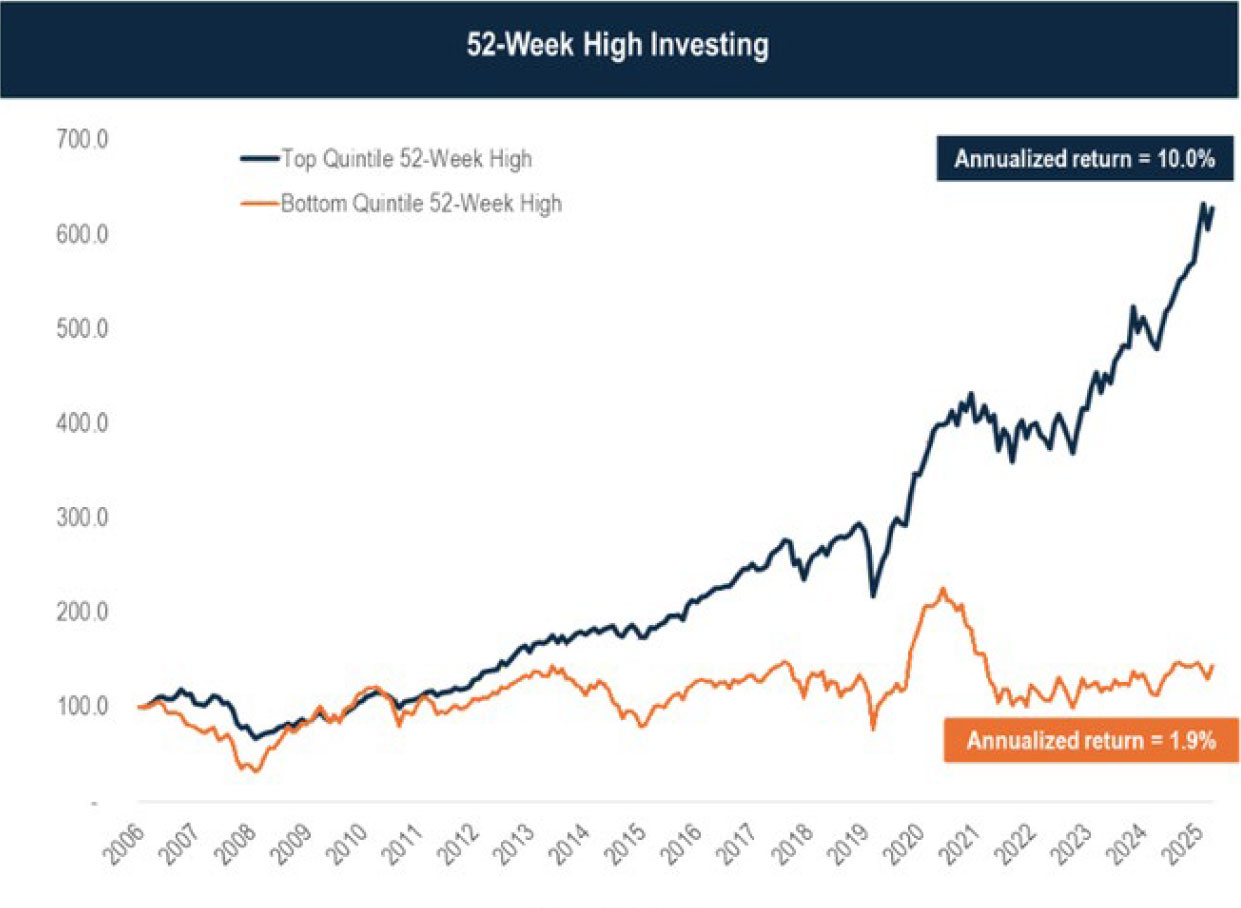
Investing in shares with positive share price momentum has been a solid strategy. The below chart shows how buying top quintile stocks, that being the top 20%, relative to their 12-month price highs provides significant outperformance over the last 20 years. This means buying those shares trading close to or at highs, and avoiding those trading close to, or at, lows. The top quintile of stocks closest to their 12-month high have returned 10.0% per annum vs 1.9% per annum for the bottom quintile. Whilst this strategy can feel uncomfortable – buying assets at highs – and it has periods where relative performance is not as strong, the tale of late, and over the long-term is there for all to see.
Source: Julian Klymochko, Accelerate on X. Available at: https://x.com/JulianKlymochko/status/2048544116959768845?s=20
MARKET DATA
Source: Alpha: data as at 05-05-26 intra-day prices

