
Monthly Market Update June 2026
Stay informed with the latest news and insights from Oxonian Capital's Monthly Market Update.
June 2026 Update:
MARKET NEWS
EQUITIES: Global equities extended April’s rebound in May as oil prices reversed sharply on improving Middle East ceasefire hopes. The S&P 500 rose +5.3% to a new high, taking year-to date gains to +11.2%. AI enthusiasm returned, especially in semiconductors, with the Philadelphia Semiconductor index up +22.2% in May and +81.5% year-to-date. Europe also advanced, with the STOXX 600 up +3.2%, while Japan’s Nikkei gained +11.9%. South Korea’s KOSPI added +28.5%, led by SK Hynix and Samsung Electronics, taking its year-to-date return to +102.4%. The FTSE 100 lagged, up just +0.7%, held back by weaker energy stocks as oil fell (-19.3%).
Company earnings remained supportive, with U.S. large-caps delivering roughly +25% growth year-on-year, led by AI-related technology, energy and financials. Forecast for earnings growth remain in double digit territory.
CURRENCY: Sterling fell -1.1% against the U.S. dollar amid domestic political turbulence after Labour’s local election losses, ministerial resignations and a by-election. Andy Burnham’s entry into the leadership debate briefly unsettled markets, due to earlier comments about fiscal rules and defence spending, before later clarification steadied sentiment. The euro also slipped (- 0.6%) against the dollar.
BONDS: Government bond yields hit multi-decade highs mid month, with the 30-year U.S. Treasury at 5.18%, the 10-year Bund at 3.19%, Japan’s 10-year at 2.78% and the 10-year gilt at 5.17%. Firm U.S. inflation and elevated oil prices drove the bond sell-off, but ceasefire progress later triggered a strong reversal. Despite volatility, gilts returned +2.0% over the month, with the 10-year yield ending at 4.81%.
Looking ahead, the Fed is now expected to hold rates steady, if not increase, while the ECB is expected to raise rates through the summer with inflation remaining sticky. We continue to prefer index-linked debt given persistent inflation pressures.
ALTERNATIVE INVESTMENTS: Brent crude fell -19.3%, its worst monthly decline since March 2020, on hopes the Strait of Hormuz could reopen. Even after the fall, oil is up +51.3% year-to-date, reverberating across the global economy.
If the Strait does reopen in June, we could see oil briefly rise before settling lower again, due to supply bottlenecks and reserve-stocking. A prolonged closure, however, could send prices up towards conflict highs, weakening growth and increasing recession risk, perhaps most notably in Europe.
Gold suffered a third consecutive negative month (-1.7%) but is still positive year-to-date (+5.1%). Despite early-2026 volatility causing concern, we still view gold as a useful diversifier, although we did reduce our position in January.
MACRO NEWS
POLITICS: The Middle East remained the focus for investors with sentiment swinging between hope and tension. There were reports on 6thMay that a framework agreement was close, only for President Trump to declare Iran's proposal "TOTALLY UNACCEPTABLE" days later. The pendulum swung again at the end of May, with a 60-day memorandum of understanding reported on 28th May.
In the U.K., the political calendar added a layer of domestic risk. The prospect of a leadership challenge to Prime Minister Keir Starmer, combined with a fraught autumn Budget, is expected to dampen both business investment and consumer spending through the second half of the year.
MONETARY POLICY: The easing interest rate cycle that defined 2025 is now firmly on hold. The central bank picture has shifted materially since the Iran conflict began, with major institutions either pausing or shifting towards a tightening stance.
In the U.S., analysts have started pushing back Fed rate-cut forecasts or even moving to a ‘wait and see’ holding pattern, citing energy cost pressures keeping core inflation closer to 3% than 2% throughout the year. This has seen markets now moving to price in greater expectations of a rate hike by the end of 2026. In Europe inflation expectations are also being revised higher, leading to prospects of rate hikes from the ECB both in June and September. The euro area is also on the verge of a technical recession, albeit equity markets currently appear to be taking that in their stride, with more of a focus on corporate earnings resilience.
Closer to home the Bank of England is expected to hold the base rate at 3.75% for this year, although inflation pressures remain and the Ofgem Price Cap rise in July (which raises dual fuel bills by 13%) will feed into that. However, there are some analysts that are now starting to view gilts as having been oversold with yields showing good value.
THE AI SUPERCYCLE: Despite the geopolitical backdrop, artificial intelligence remains the market’s defining theme. What began as enthusiasm around a narrow group of technology companies has moved into a deeper investment cycle spanning semiconductors, data centres, power, networking and sections of enterprise software. Benefits are also becoming more tangible, with companies more focused on productivity gains and monetisation rather than experimentation alone. While some valuations look stretched and (potentially significant) volatility should be expected, we continue to view AI as a transformational force. Investors should therefore be cautious about remaining on the sidelines for too long as the opportunity set widens.
CHART OF THE MONTH
Perhaps understandably equity market valuations are regularly touted as being stretched, and the U.S. would certainly look that way versus historic levels. However, whilst commonly discussed in market circles, in the public domain the valuations of debt – the most common way of measuring it being spreads to government debt – is also at record levels. The right-hand chart below shows various classes of fixed income and how they currently compare to 25 years averages, in all cases being at the within the top10% most expensive – i.e. lowest level of spread. In our view, it pays to be selective in these market conditions.
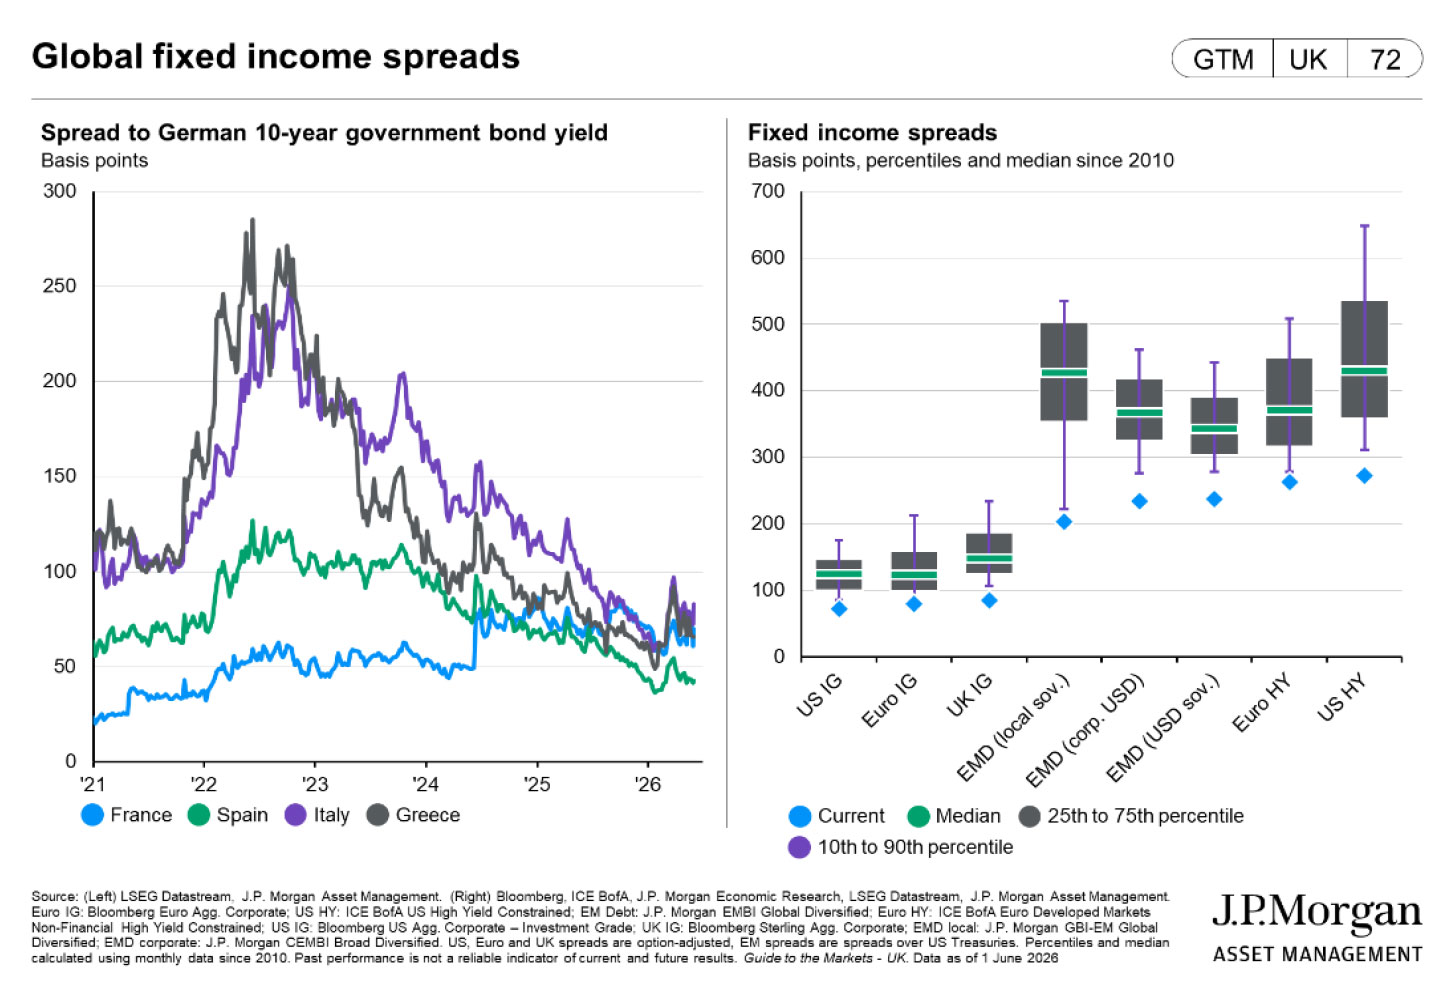
Source: J.P. Morgan Asset Management. Guide to the Markets. Available at: https://am.jpmorgan.com/gb/en/asset-management/liq/insights/market-insights/guide-to-the markets/
MARKET DATA
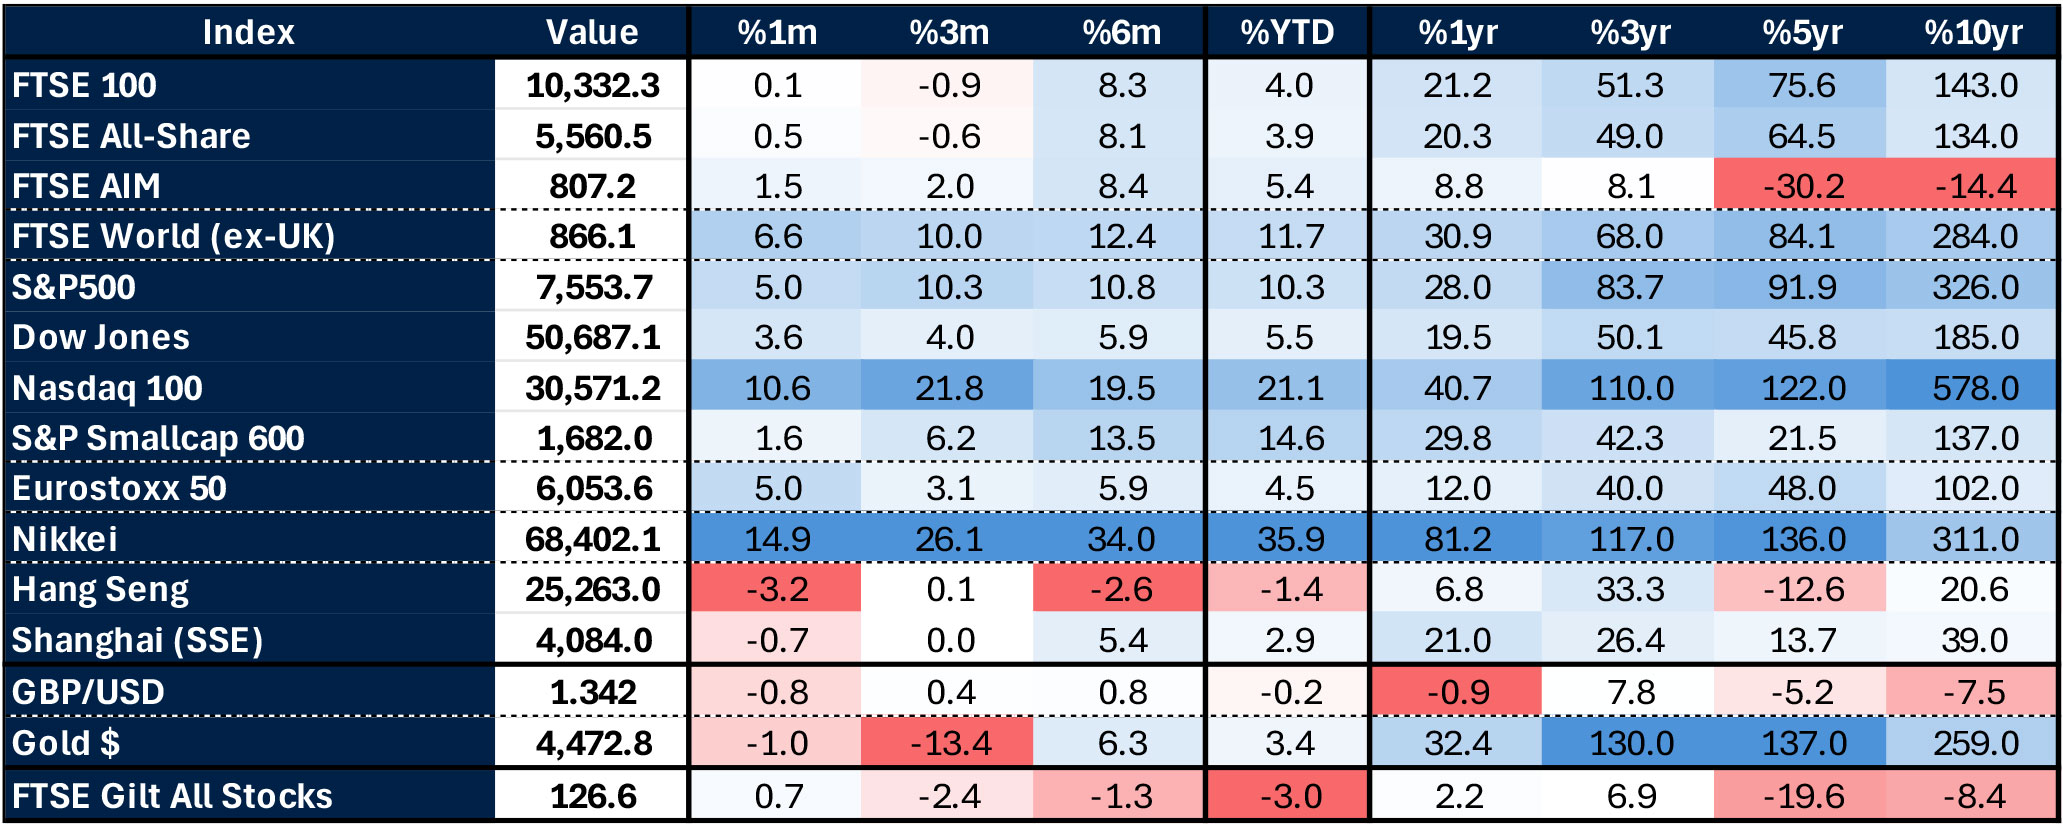
Source: Alpha: data as at 04-06-26

